Data Visualization Solution Visualization
representative image
Main Text
Data Visualization, Dashboard "nTOMView"
"nTOMView" is a solution to visualize datas and informations to support decision-making on phenomena occurring in various fields such as public administration, IoT, smart city, smart grid, and IT governance.
System Concepts Diagram
Strong Points
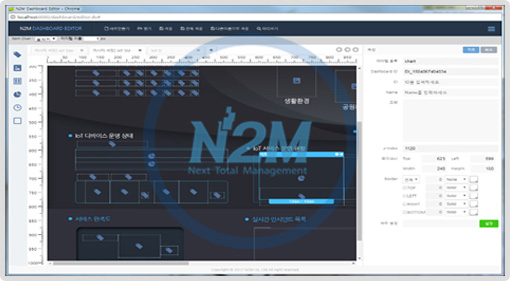
- Screen composition by document design method
- It takes the same on-screen approach as the document editor. It adopts a WYSIWYG method to support intuitive screen configuration
- Batch work can be carried out by supporting multi-document editing functions
- Data Setting Function
- It provides various types of data map setting functions such as Polling, Request, and Message
- It filters the data set in the map and provides the function to utilize it in the dashboard
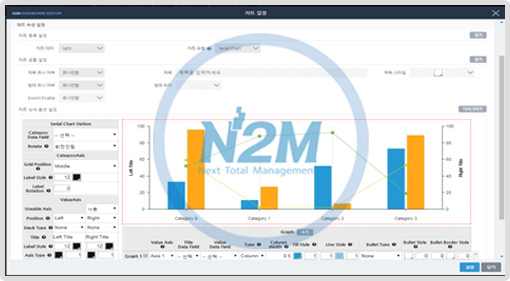
- Data Visualization
- It provides a screen design function that allows users to visualize data. Analyze related information flexibly
- NTOMView component is provided as a basic, enabling the use of components for data visualization
- Message Notification Feature
- Supports audiovisual Notification of failure messages on managed equipment
- Visual notification is supported by displaying defined color icons when messages are generated for the configured equipment on the screen
- Audible notification is supported by playing defined sounds when messages are generated for the configured equipment on the screen
- Multi-client Editing and Viewer Environments
- All configured files and data are stored on the server. Multiple connected users can view files and data in the same configuration
- For the viewer, it supports data synchronization between users. Multiple work environments are supported for one system
- Page Access Configuration
- You can restrict access to pages based on user privileges, thereby maintaining security for specific pages
- The page branch can be applied depending on the user's tasks, so specific pages can be organized by the user
- It supports data filtering functions so that control data can be classified according to tasks
- Real-time Monitoring
- Supports automatic updating of data for control. The person in charge can respond quickly to the problems
- Adopt a flexible approach to automatic updating of data to organize user interface screens for various forms of control
Screenshots
Applied Cases
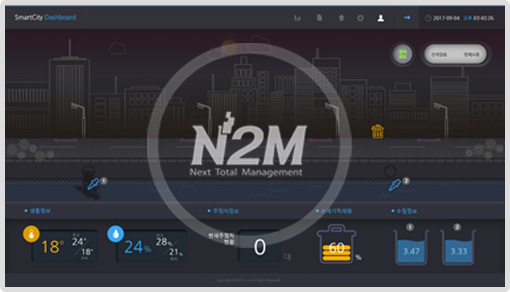 IoT - SmartCity Services Dashboard
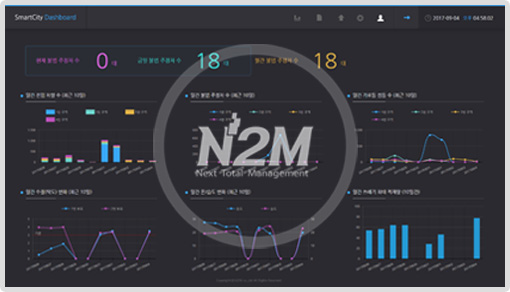 SmartCity - IoT equipment statistics
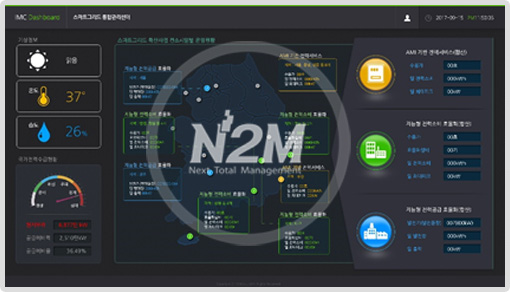 SmartGrid
Applied Cases - Operating and Controlling IT Services
 ITSM
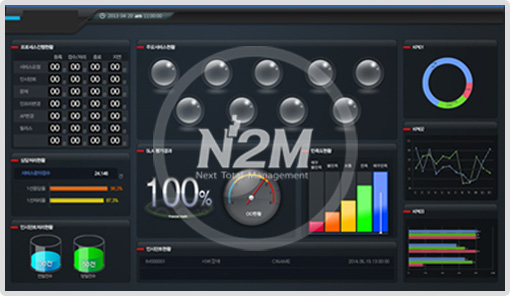
ITSM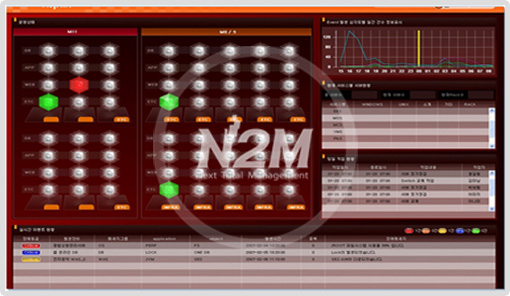 IT Integrated control
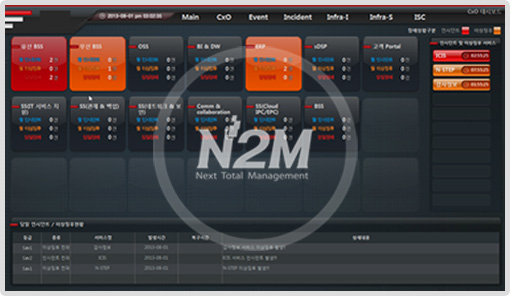 CxO Dashboard
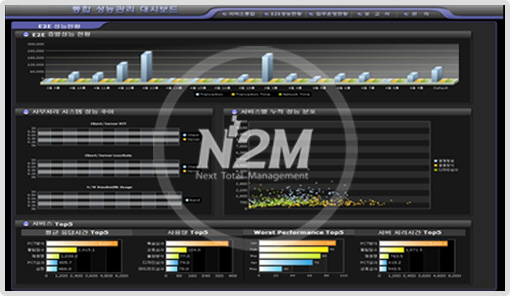 Performance Management